In today’s data-driven world, computer charts have become an indispensable tool for visualizing and analyzing complex information. From business and finance to healthcare and education, computer charts have found a multitude of applications that have transformed the way we understand and interpret data.

In this article, we will delve into the various uses of computer charts and explore how they can enhance decision-making, aid in analysis, and revolutionize different industries.
Uses of Computer Chart in Daily Life
Table of Contents
1. Computer Charts in Business
Computer charts have revolutionized the way businesses analyze and present data. Whether it’s sales figures, market trends, or customer feedback, computer charts provide a visual representation of valuable information that can be easily understood and interpreted.
When it comes to business presentations, computer charts are invaluable. They allow presenters to convey complex data in a visually appealing and easy-to-understand manner. Whether it’s a quarterly report or a pitch to potential investors, computer charts make it easier to communicate key information effectively.
2. Computer Charts For Enhance Data Visualization
Data visualization is a powerful tool that allows us to understand and interpret large amounts of information quickly and efficiently. Computer charts play a crucial role in data visualization by transforming complex datasets into visual representations that are easy to comprehend.
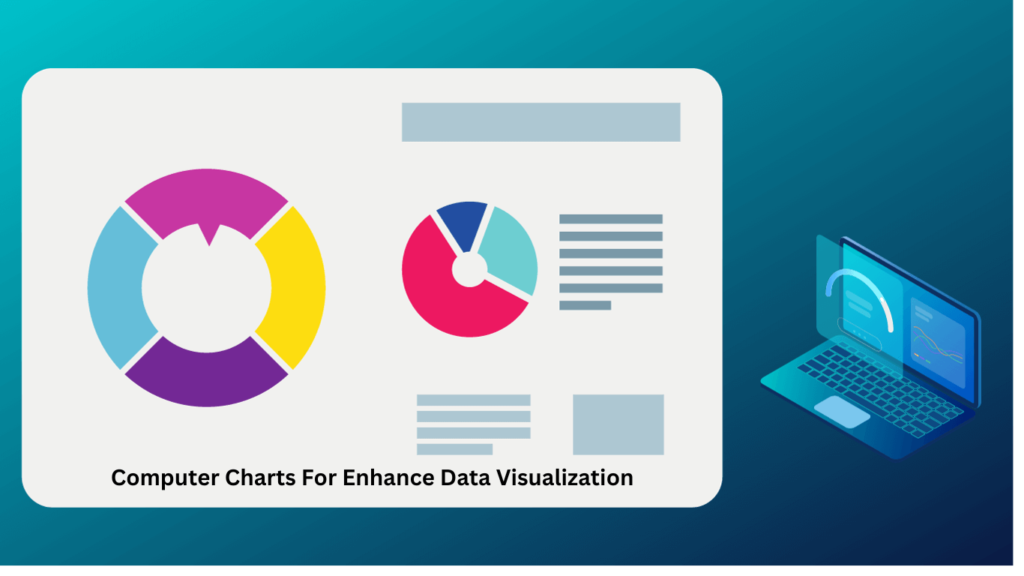
With the help of computer charts, we can identify patterns, detect anomalies, and gain insights that may not be apparent from raw data alone. Whether it’s zooming in on a specific period in a line chart or filtering data based on specific criteria in a bar chart, computer charts empower users to explore and analyze data dynamically and intuitively.
3. Computer Charts for Decision-Making and Analysis
In today’s fast-paced business environment, making informed decisions quickly is crucial for success. Computer charts play a vital role in aiding decision-making by providing a visual representation of data that is easy to understand and analyze.
Computer charts also facilitate data analysis by enabling users to identify patterns and relationships in data. By visualizing data on a chart, users can easily spot trends, outliers, and correlations that may not be apparent from raw data alone. This analysis can provide valuable insights and inform decision-making processes.
4. Computer Charts in Scientific Research
In the field of scientific research, computer charts have become an essential tool for analyzing and presenting data. Whether it’s analyzing experimental results, visualizing research findings, or communicating complex scientific concepts, computer charts play a crucial role in advancing scientific knowledge.

Computer charts are particularly useful in data analysis and hypothesis testing. By visualizing data on a chart, researchers can identify patterns, trends, and outliers that may not be evident from raw data alone. This visualization enables researchers to gain insights, draw conclusions, and make evidence-based decisions.
5. Computer Charts for Educational Purposes
Computer charts have transformed the way we teach and learn by making complex information more accessible and engaging. Whether it’s in the classroom or online, computer charts are used to present information, explain concepts, and facilitate interactive learning.
Computer charts also facilitate interactive learning experiences. By using interactive charts, students can manipulate and explore data, conduct experiments, and test hypotheses. This hands-on approach to learning encourages active engagement and critical thinking, making the learning process more effective and enjoyable.
6. Enhancing Presentations with Computer Charts
In today’s digital age, captivating presentations are essential for grabbing the attention of the audience and conveying key messages effectively. Computer charts are a powerful tool for enhancing presentations by making complex data more accessible and engaging.
Computer charts also add visual interest to presentations, making them more engaging and memorable. By using colors, shapes, and different chart types, presenters can create visually appealing slides that capture the audience’s attention.
Whether it’s a pie chart illustrating market segmentation or a scatter plot displaying the correlation between variables, computer charts make presentations more visually appealing and dynamic. This visual interest helps to keep the audience engaged and enhances their overall experience.
7. Computer Charts in Finance
In the world of business and finance, computer charts have become an indispensable tool for analyzing and presenting data. Whether it’s tracking financial performance, analyzing market trends, or visualizing investment portfolios, computer charts provide valuable insights that drive informed decision-making.

Computer charts are particularly useful in financial analysis and forecasting. By visualizing financial data on a chart, analysts can identify trends, patterns, and anomalies that may not be apparent from raw data alone. This analysis enables businesses to make informed decisions regarding investments, budgeting, and financial planning.
8. Computer Charts in Healthcare and Medicine
In the field of healthcare and medicine, computer charts have revolutionized the way we analyze and interpret patient data. Whether it’s tracking patient outcomes, visualizing medical imaging, or monitoring public health trends, computer charts provide valuable insights that improve patient care and advance medical research.
Computer charts are particularly useful in patient data analysis and clinical decision support. By visualizing patient data on a chart, healthcare professionals can identify patterns, trends, and outliers that may not be apparent from raw data alone.
9. Computer Charts in Journalism and Media
In the world of journalism and media, computer charts have become an essential tool for presenting data-driven stories and engaging the audience. Whether it’s visualizing election results, analyzing public opinion, or tracking social media trends, computer charts provide journalists with a powerful tool for data journalism.
Computer charts also enable journalists to conduct data analysis and uncover hidden patterns and trends. Whether it’s analyzing election results, studying demographic trends, or investigating social issues, computer charts provide journalists with a powerful tool for data-driven reporting.
By visualizing and analyzing data on a chart, journalists can identify key findings, draw meaningful conclusions, and present evidence-based stories. This data-driven approach enhances the accuracy and quality of journalism and fosters a more informed and engaged society.
10. Computer Charts in Sports and Entertainment
In the world of sports and entertainment, computer charts have transformed the way we analyze and interpret performance data. Whether it’s tracking player statistics, visualizing game strategies, or analyzing audience engagement, computer charts provide valuable insights that enhance performance and fan experience.

Computer charts are particularly useful in sports performance analysis and coaching. By visualizing player performance data on a chart, coaches and analysts can identify strengths, weaknesses, and areas for improvement. Whether it’s analyzing player movements, tracking performance metrics, or comparing team statistics, computer charts provide sports professionals with a powerful tool for performance analysis and coaching.
Conclusion: Uses of Computer Chart in Daily Life
Computer charts have revolutionized the way we visualize, analyze, and interpret data across various industries. From business and finance to healthcare and education, computer charts have found versatile applications that enhance decision-making, aid in analysis, and transform the way we understand complex information.
Whether it’s presenting financial data, tracking patient outcomes, or visualizing scientific research findings, computer charts provide valuable insights that drive informed decision-making and advance knowledge in different fields. By unlocking the power of computer charts, we can unlock the power of data and harness its potential to transform industries, drive innovation, and improve our understanding of the world around us.
FAQ: Uses of Computer Chart in Daily Life
Q1. What are the Uses of Computer Charts?
Ans. In today’s data-driven world, computer charts have become an indispensable tool for visualizing and analyzing complex information. From business and finance to healthcare and education, computer charts have found a multitude of applications that have transformed the way we understand and interpret data.
Q2. TOP 10 Uses of Computer Chart.
Ans. The top ten used computer chart are the followings-
1. Computer Charts in Business
2. Computer Charts For Enhance Data Visualization
3. Computer Charts for Decision-Making and Analysis
4. Computer Charts in Scientific Research
5. Computer Charts for Educational Purposes
6. Enhancing Presentations with Computer Charts
7. Computer Charts in Finance
8. Computer Charts in Healthcare and Medicine
9. Computer Charts in Journalism and Media
10. Computer Charts in Sports and Entertainment
Q3. What are the uses of Computer Charts in Business?
Ans. Computer charts have revolutionized the way businesses analyze and present data. Whether it’s sales figures, market trends, or customer feedback, computer charts provide a visual representation of valuable information that can be easily understood and interpreted.
When it comes to business presentations, computer charts are invaluable. They allow presenters to convey complex data in a visually appealing and easy-to-understand manner. Whether it’s a quarterly report or a pitch to potential investors, computer charts make it easier to communicate key information effectively.
Q4. What are the uses of Computer Charts in Scientific Research?
Ans. In the field of scientific research, computer charts have become an essential tool for analyzing and presenting data. Whether it’s analyzing experimental results, visualizing research findings, or communicating complex scientific concepts, computer charts play a crucial role in advancing scientific knowledge.
Computer charts are particularly useful in data analysis and hypothesis testing. By visualizing data on a chart, researchers can identify patterns, trends, and outliers that may not be evident from raw data alone. This visualization enables researchers to gain insights, draw conclusions, and make evidence-based decisions.